Displai research · 201 owners and partners
The QSR and Fast Casual Restaurant Report
We asked 201 owners and partners of quick service (QSR) and fast casual restaurants across the US how business is going, what gets in the way, and what they are planning next. Here is what they told us, chapter by chapter.
Scroll to read the report
say their restaurant's financial health is excellent or good. Yet labor shortages, competition and supply chains still top the worry list.
Key findings
Four key findings from 201 restaurant owners
66% of US QSR and fast casual owners rated their finances excellent or good, and 64% were optimistic about the year ahead. The pressure is in people: finding them, keeping them and reaching them. Technology is seen as the future, and its price tag is the barrier owners name most.
- 0135%
Labor shortages are the biggest challenge restaurants face
Increased competition (32%) and supply chain disruptions (31%) follow. Two in three owners changed how they hire this year.
Hiring and retention - 0240%
The hardest part of talking to staff is getting everyone in one room
Shifts rarely line up. Limited access to technology among employees (34%) and messages that go unread (24%) are the next two barriers.
Employee communication - 0351%
Upfront cost is what keeps new technology out of the restaurant
Half of owners name high upfront cost as a barrier, more than any other, ahead of training staff (32%) and data security concerns (31%).
Technology - 0441%
Four in ten owners expect technology to be a major driving force
Another 27% call it significant. What is already in use: online ordering and delivery platforms (51%), POS systems (27%) and mobile apps for ordering and loyalty (27%).
What they run today
Contents
Seven chapters, one survey
Every number comes from one survey of 201 owners. A few are shares of a subgroup, and those charts say so. Each chapter ends with a short summary and a link to the next.
Chapter 01
The state of QSR and fast casual restaurants
66% of QSR and fast casual owners rate their financial health excellent or good, and 58% saw foot traffic rise over the past year. The worry list is still long.
Scroll to explore three findings
Financial health
Two in three QSR and fast casual owners are meeting or beating their financial targets
27% call their financial health excellent and say they are exceeding targets. Another 39% are good and on target. At the other end, 10% are struggling to meet targets and 8% describe their situation as critical, weighing closure or drastic measures.
How would you describe your restaurant's current financial health?
n = 201- Excellent, exceeding targets27%
- Good, meeting targets39%
- Fair, slightly below but managing15%
- Poor, struggling to meet targets10%
- Critical, considering closing8%
Customer foot traffic
More than half of restaurants saw foot traffic rise over the year
Foot traffic rose significantly for 21% and slightly for 37%. It held flat for 14%. For roughly one in four it fell: slightly for 19%, significantly for 8%.
How has customer footfall changed compared with last year?
n = 201- Increased significantly21%
- Increased slightly37%
- Stayed the same14%
- Decreased slightly19%
- Decreased significantly8%
Top challenges
Labor shortages are the most named restaurant challenge, with competition and supply chains close behind
Owners could pick every challenge that applied. The five most named are people, rivals, ingredients and cost. The top three sit within four points of each other, which at this sample size is close to a tie. Technology itself is near the bottom of the list, which makes the barriers in chapter five more telling.
Which challenges does your restaurant face today?
Select all that applyHealthy vs struggling
Foot traffic is not what separates the two
- Top challenge
- Labor shortages
- Foot traffic
- 36% saw it decrease, and are exceeding targets anyway
- Top challenge
- Regulatory or compliance issues, tied with declining customer demand
- Foot traffic
- 63% saw it increase, and are still considering closing
So what: getting people through the door helps, but it does not sort the healthy from the critical on its own. The report reads this as other operating factors mattering more than traffic. Treat it as a lead, not a result: the critical group is about 16 owners.
Subgroup sizes were not published. Derived from the chapter one shares: excellent about 54 owners, critical about 16, excellent or good about 133, poor or critical about 36.
In short
Owners are seeing good signs: 66% rate their finances excellent or good and 58% saw foot traffic rise over the year. The challenges that remain are labor shortages, increased competition and supply chain disruptions.
Which challenge ranks first differs by financial health. The healthiest worry about labor. The ones in critical shape worry about compliance and demand.
Next, hiring and retentionChapter 02
Restaurant hiring and retention
Labor shortages are the challenge QSR and fast casual owners name most, at 35%. Nearly every role in the building has an open seat somewhere, and most owners have already rewritten how they hire. Far fewer have changed how they keep people.
Scroll to explore three findingsof owners changed their hiring strategy this year. Among them, labor shortages ranked as the top challenge.
Open roles
Cooks are the hardest restaurant position to fill
Cooks lead the vacancy list by a wide margin, followed by assistant managers and cashiers. Store managers are open at one in five restaurants. No role on the list is below 11%, which means every position is a hiring problem for some owner.
Which positions are you struggling to fill?
Select all that apply; base not statedNew hiring strategies
Benefits and wages are the first levers pulled
Among owners who changed their approach, half added benefits like health insurance and bonuses, and 42% raised starting wages. Flexible hours came next. Both top answers cost money. The report notes they were the choice of owners in excellent or good financial health, while poor or critical owners went to job fairs and job boards.
How did you change your hiring strategy?
Among the 68% who changed it, about 137 ownersThe gap
Only one in eight chose to keep people instead of replacing them
Retention sits second to last on the list, just above referral programs. Every other strategy spends money or time finding the next hire. Holding on to the current crew is the one approach the report says every owner should adopt.
Three strategies, three price tags
Among the ~137 who changed strategy- Offered additional benefits48%
Health insurance, bonuses. The route the report associates with owners in excellent or good financial health, alongside higher wages (42%).
- Hosted job fairs or open interview days22%
Low-cost reach. The route the report associates with owners in poor or critical health, alongside heavier use of online job platforms (23%).
- Prioritized retention to hire less12%
One of the two least chosen strategies, and the one the report tells every owner to adopt.
Each figure is one survey item, not a bundle. Shares are of the roughly 137 owners who changed strategy.
In short
Every role on the list was named by at least 11% of owners, and cooks by more than a third. Two in three owners changed how they hire. Owners in good financial health added benefits and raised wages. Owners in poor or critical health went to job fairs and job boards.
Only 12% invested in keeping the people they already had. It is one of the two least chosen strategies, and the only one the report tells every owner to adopt.
Next, employee communicationChapter 03
Restaurant employee communication
40% of restaurant owners rely on in-person meetings to reach staff, and 40% say scheduling those meetings across shifts is their biggest communication barrier. The whole team is rarely in the building at once.
Scroll to explore three findings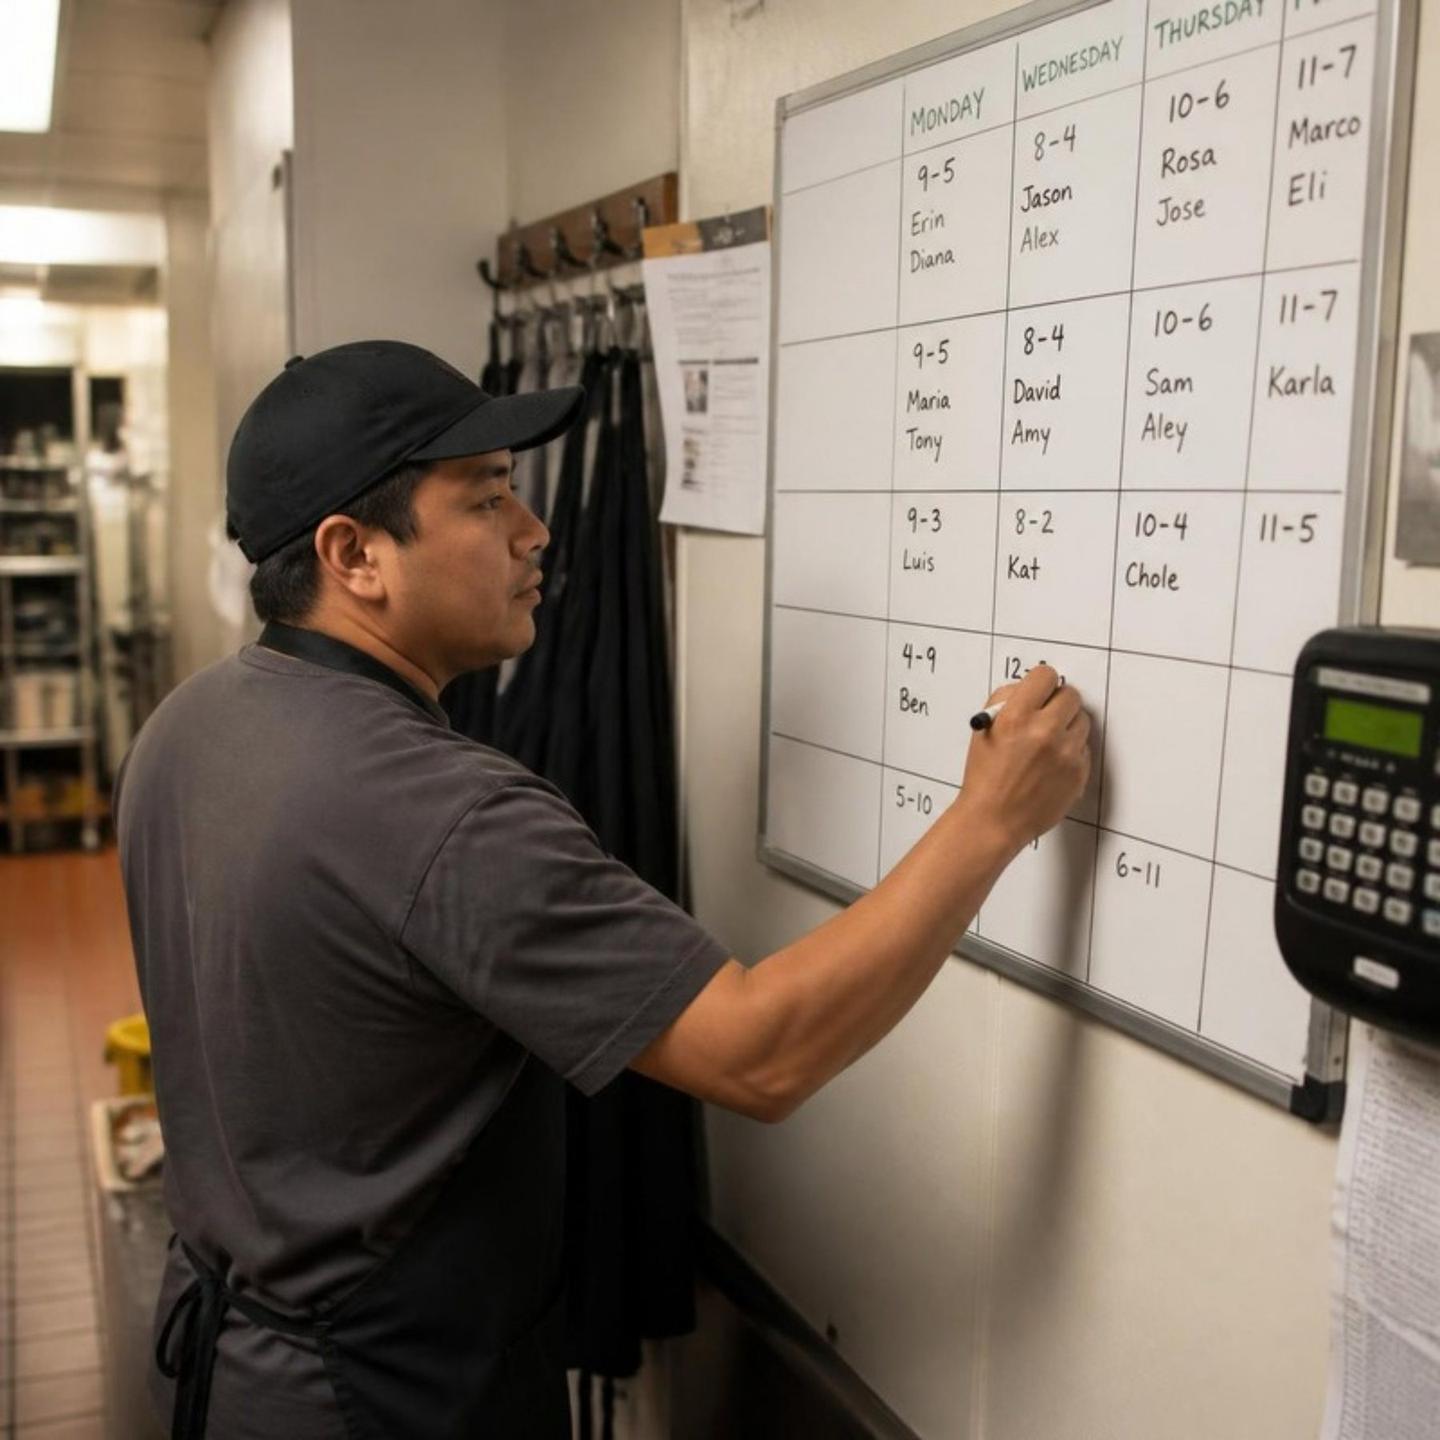
Primary channel
In-person meetings lead every other channel, at 40%
Four in ten rely on meetings first, far ahead of any other channel. Phone calls, text, mobile apps, company portals, email and bulletin boards make up the rest. Weekly is the most common cadence, at 38%.
How often do you hold staff meetings?
Single answer, n = 201The primary-channel chart was published without value labels, so meeting frequency is charted instead. Channels ranked from that chart: in-person meetings (40%), then phone calls, text, mobile apps, company portal, email, bulletin boards.
Urgent changes
When something changes fast, nearly half pick up the phone
For urgent information or sudden changes, phone calls lead. Group text and mobile apps follow, then in-person, email and bulletin boards. Separately, 63% use some form of technology for scheduling and communication.
How do you communicate urgent information or sudden changes?
Single answer, n = 201- Phone calls46%
- All other channels combined54%
Only the leading value was published. Other channels, by rank from the published chart, which carries no value labels: group text, mobile apps, in person, email, bulletin boards. Separately, 63% of owners use technology such as communication apps or scheduling software for scheduling and communication.
Barriers
Scheduling an all-staff meeting is the number one communication barrier
The top channel is a meeting, and the top barrier is finding a time when everyone can be there. Next is access: a third of owners say some employees lack the technology or the skills to use it, so digital channels leave people out.
What gets in the way of effective employee communication?
Select all that applyHealthy vs struggling
Successful restaurants talk directly. Struggling ones post and hope.
- Primary channel
- In-person meetings
- For urgency
- Phone calls
- Use technology
- 69%
- Biggest barrier
- Finding a time when everyone can meet
- Primary channel
- Company intranet or portal
- For urgency
- Mobile apps
- Use technology
- 38%
- Biggest barrier
- No centralized platform or system
So what: the report's reading is that healthier restaurants typically use proactive, direct, two-way methods, and struggling ones typically use passive, indirect, one-way methods. The survey cannot say which comes first.
Subgroups derived from chapter one: excellent or good about 133 owners, poor or critical about 36.
In short
Owners prefer face-to-face meetings, most often weekly, and the phone when things change fast. 63% use technology to help with scheduling and communication. The barriers are practical: shifts that never overlap, staff without access to the tools, and messages that go unread or misunderstood across languages.
The split by financial health is wide here: 69% versus 38% using technology. Direct, two-way communication goes with success in this sample. The survey cannot say which comes first.
Next, customer experienceChapter 04
Restaurant customer experience
Half of QSR and fast casual owners have invested in comfortable seating, and 24% learn about the guest experience from online reviews. Owners are listening through reviews and feedback cards, investing in the room, and training the crew to deliver the same experience on every visit.
Scroll to explore three findingshave invested in comfortable seating, the most common upgrade to the physical space.
Listening
Owners hear about the experience online and at the table
Online reviews and social media tie with feedback cards as the main way owners learn how a visit went. Asking guests directly and running regular surveys follow. Few have built a feedback channel into their own website or app.
How do you learn about your customers' experience?
Shares sum to about 100%, so read as one answer per ownerThe room
Half have made the space more comfortable, and four in ten made it more theirs
Seating leads. Themed or branded interiors and ambient lighting and music follow. Almost a third have added interactive or entertainment elements such as digital displays, and 27% have installed clear signage and menu displays.
What have you done to improve layout and ambiance?
Select all that applyThe crew
Consistency comes from training, then from incentives
Regular customer service training is the most common way to keep quality even across shifts. Nearly a quarter run incentive programs for top performers based on customer feedback, and one in five sends in mystery diners.
How do you ensure staff deliver a consistent experience?
Shares sum to about 100%, so read as one answer per ownerIn short
Owners learn how a visit went from online reviews, feedback cards and direct conversation. They improve the room with comfortable seating, branded interiors and ambient lighting and music. They keep service consistent with training, incentive programs for top performers and mystery diners.
Technology shows up on both sides of this chapter, in the digital displays guests see and the feedback systems owners read. The next chapter covers what else they run.
Next, technologyChapter 05
Restaurant technology adoption
51% of QSR and fast casual restaurants run online ordering and delivery platforms, and 51% say upfront cost is what keeps other technology out. Owners run a mixed stack, see technology as the future, and name one barrier above all others: the bill.
Scroll to explore three findingsbelieve technology will be a major driving force in the future of QSR and fast casual. Another 27% call it significant.
In use today
Half of restaurants run online ordering and delivery. Nothing else reaches three in ten.
Online ordering and delivery platforms are the only technology more than half of owners use. POS systems and mobile apps for ordering and loyalty each sit at 27%. Digital menu boards and kiosks are at 19%.
Which technologies do you currently use?
Select all that applyBarriers
Upfront cost is the top barrier to restaurant technology, then training
Half of owners say high upfront cost keeps technology out. Difficulty training staff, data security concerns and integration with existing systems cluster around 30%. Reliability, vendor support and customer hesitation each sit near 20%.
What makes technology hard to adopt or use?
Select all that applyThe future
Two in three see technology as major or significant to what comes next
41% call it a major driving force and 27% significant but not dominant. 17% see it as one factor among many, and 15% expect minimal impact. Belief is broad. Cost is the barrier owners name most.
What role will technology play in the future of QSR and fast casual?
n = 201- A major driving force41%
- Significant, but not dominant27%
- One of many factors17%
- Minimal impact15%
In short
Technology is already part of daily operations: half of owners run online ordering and delivery, 27% run POS systems and 27% run mobile apps. Adoption has not been smooth. High upfront cost is the biggest barrier, with staff training and data security behind it.
Even so, 41% believe technology will be a major driving force and 27% call it significant. The barriers describe tools that are too expensive, too hard to learn and too hard to connect, not a lack of belief.
Next, delivery and ghost kitchensChapter 06
Delivery and ghost kitchens
61% of QSR and fast casual restaurants operate a ghost kitchen, and 55% feel positive about third-party delivery platforms. Owners mostly like the platforms, dislike the fees, and more than half already run a ghost kitchen in some form. Where dine-in ends up is the open question.
Scroll to explore five findings
Platforms and sentiment
More than half feel positive about third-party delivery
28% are very positive and 27% positive. Roughly a quarter are neutral, and 22% are negative or very negative. Ranked from the published platform chart, which carries no value labels: Uber Eats and Grubhub lead, followed by in-house delivery, DoorDash and Postmates.
How would you rate your overall experience with third-party delivery platforms?
n = 201- Very positive28%
- Positive27%
- Neutral23%
- Negative14%
- Very negative8%
Platform challenges
The fee is the complaint. Food quality on arrival is the worry.
Commission fees lead, then food that arrives late or cold, then the work of managing orders and payments. A quarter struggle to communicate with the platform or its drivers, and one in five feels the direct customer relationship slipping away.
What challenges do third-party platforms create?
Select all that applyPromotions
Nearly three in four run deals through delivery apps
Almost half offer promotions frequently and a quarter do it around holidays and events. Of the rest, 14% are considering it and 13% have no plans to start.
Do you offer promotions or exclusive deals through delivery platforms?
n = 201- Yes, frequently48%
- Occasionally, for events or holidays24%
- Not yet, but considering it14%
- No, and no plans to13%
Ghost kitchens
Six in ten QSR and fast casual restaurants already operate a ghost kitchen
42% run one alongside a traditional dining space and 19% operate exclusively as a ghost kitchen. Another 22% are considering it. The concerns mirror delivery itself: food quality in transit, dependence on platform fees, and losing the face-to-face rapport.
Are you operating a ghost kitchen?
n = 201- Yes, in addition to a dining space42%
- Yes, exclusively19%
- Not yet, but considering it22%
- No, and no plans to19%
Top concerns about ghost kitchens: food quality during delivery (45%), dependence on third-party platforms and fees (42%), less direct interaction with customers (39%), maintaining brand identity (25%), competition from other ghost kitchens (20%).
Dine-in vs delivery
A balance is the most common plan. A quarter think delivery may overtake dine-in.
36% intend to keep dine-in and delivery in balance, and 24% say dine-in stays primary. 23% believe delivery may surpass dine-in, and 7% are considering shifting mainly to delivery and shrinking the dining room. 9% are unsure.
How will you approach dine-in and delivery going forward?
n = 201In short
Delivery is now part of operations. 55% feel positive about third-party platforms and 72% use them to run promotions. The cost is the commission, and the risk is food that does not travel well. 61% already run a ghost kitchen in some form and another 22% are thinking about it.
On the future, owners are split: a third want balance, a quarter will keep dine-in first, and a quarter expect delivery to overtake it.
Next, outlook and prioritiesChapter 07
Outlook and priorities for the year ahead
64% of QSR and fast casual owners are optimistic about the future, and 43% plan to open new locations in the year ahead. Most owners feel good about what is coming, and their plans for the year ahead lean outward: new locations, new menus, new campaigns.
Scroll to explore three findingsfeel optimistic or very optimistic about their restaurant's future prospects.
Optimism
Optimism runs close to financial health
30% are very optimistic and 34% optimistic. 15% are neutral. 21% are pessimistic or very pessimistic. The report says optimism tracks closely with the financial health rating in chapter one, where 18% rated themselves poor or critical.
How do you feel about your restaurant's future prospects?
n = 201- Very optimistic30%
- Optimistic34%
- Neutral15%
- Pessimistic11%
- Very pessimistic10%
Planned initiatives
More than four in ten owners plan to open new locations in the year ahead
Expansion leads, followed by marketing campaigns, menu changes and remodels. Fewer than one in five has no major changes planned.
Which initiatives are you planning for the coming year?
Select all that applyPriorities
Growth and menu lead the list. People and digital sit in the middle.
Expanding to new locations and menu innovation tie at the top. Customer experience follows. Employee training and retention, and digital transformation, land around one in five. Streamlining operations sits in the lower half at 16%.
What are your top priorities for the coming year?
Select all that applyHealthy vs struggling
The healthy look outward. The struggling look inward.
- Priorities
- Expanding to new locations, menu innovation, improving customer experience
- Priorities
- Streamlining operations, health and safety measures, digital transformation
So what: the report's advice follows from the split. Set operations, communication and customer service first, then spend outward.
Subgroups derived from chapter one: excellent or good about 133 owners, poor or critical about 36.
In short
64% of owners are optimistic about the future. Their plans for the year ahead are mostly growth: new locations, menu changes, marketing campaigns and remodels. Customer experience, employee training and retention, and digital transformation follow.
Healthy restaurants are focusing outward. Struggling ones are focusing inward. The sequence matters: internal first, then external.
Next, six takeaways for leadersActionable takeaways
Six things restaurant leaders can act on now
Expectations are rising on every front: food and experience, engaged employees, smooth operations, fresh menus and new technology. Each takeaway pairs what the survey found with what to do about it.
- TAKEAWAY 1
Overcome the barriers to technology
The top barriers are high upfront cost, difficulty training staff, data security concerns, integration with existing systems and reliability. That describes tools owners found too expensive, too hard to use and a poor fit.
Do the research before you buy. Look for vendors building affordable, easy-to-use tools that integrate with what you already run and can plug in without a project.
- TAKEAWAY 2
Address labor shortages on both ends
Vacancies run from cooks to managers, and two in three owners have already changed how they hire. Only 12% prioritized keeping the people they have.
If you can offer benefits, higher starting wages or flexible schedules, do it. If not, use open houses, job boards and local schools. Above all, retain the crew you have: listen to feedback, build morale and connect them to the mission.
- TAKEAWAY 3
Make employee communication proactive and two-way
Owners run meetings and use apps, but staff lack access, speak different languages and are rarely all in the building at once. Healthy restaurants typically use direct, two-way channels. Struggling ones typically do not.
Pick whatever works for your crew, but make sure it is proactive, direct, two-way and accessible to everyone on every shift.
- TAKEAWAY 4
Differentiate against increased competition
Competition is the second biggest challenge. The answer is service, value and an experience guests cannot get elsewhere.
Change the room: comfortable seating and branded interiors. Invest in regular customer service training, new technology and a revitalized menu.
- TAKEAWAY 5
Decide your approach to delivery
Demand for delivery is high and ghost kitchens are common, but owners are split on whether dine-in or delivery leads from here.
Choose delivery only, dine-in only or a balance, backed by data on your customers. Pick a platform, test methods, staff for peak delivery windows, build a pickup area and track every delivery initiative.
- TAKEAWAY 6
Set your priorities in the right order
Healthy restaurants are expanding and innovating. Struggling ones are fixing operations. The report's advice: internal first, then external.
Audit finances, customer feedback and turnover first. Strengthen core competencies, then expand. New locations do not fix unstandardized operations, and marketing does not fix poor service reviews.
Methodology
Who we surveyed and how
Starting October 31, 2023, we surveyed 201 owners or partners of quick service or fast casual restaurants in the United States. The survey ran online through Pollfish using organic sampling. Percentages are shares of all 201 respondents unless a figure says otherwise.
- Definitions. Quick service (QSR) means counter ordering with no table service. Fast casual means counter ordering with made-to-order food and seating. Respondents self-identified as owners or partners of one or the other; results are not broken out by type.
- Sampling. Organic sampling means respondents were recruited inside partner apps and websites and screened by Pollfish, not drawn from a probability sample. No margin of error applies. Treat gaps of a few points as ties.
- Rounding. Figures are reproduced as published, rounded to whole percentages. Derived totals (66%, 58%, 68%, 55%, 72%, 61%, 64%) are sums of the published parts, so they can differ by a point from an unrounded total.
Years in business
ResponsesCounts read from the published chart. The largest group, 83 of 201, had been open four to six years, so they ran through the shutdown years.
Type of restaurant
Largest first- Americanlargest, about a third
- Pizza and pasta
- Mexican
- Chicken
- Desserts
- Asian, sandwiches, barbecue
- Seafood, breakfast, vegetarian, salads
The published report shows shares as a chart without labels, so categories are listed in order of size rather than with percentages.
Number of locations
Largest first- 5 to 10 locationslargest group
- 1 to 5
- 11 to 20
- 41 to 50
- 31 to 40
- 21 to 30
- 50 or more
Buckets are as published and overlap at five locations. Small multi-unit operators dominate; the 1 to 5 bucket does not separate single-store owners.
Quick answers
Questions this report answers
Each answer comes straight from the survey of 201 QSR and fast casual owners, fielded in 2023. Follow the chapter links for the full numbers.
What is the biggest challenge facing QSR and fast casual restaurants?+
Labor shortages, named by 35% of QSR and fast casual owners surveyed in 2023. Increased competition (32%) and supply chain disruptions (31%) follow, then employee communication (27%) and high operating costs (25%). Only 13% named technology itself. See chapter one, the state of QSR and fast casual restaurants.
What does QSR mean, and how is it different from fast casual?+
QSR stands for quick service restaurant, the industry term for fast food: counter or drive-thru ordering, little or no table service and fast preparation. Fast casual restaurants also use counter ordering but offer made-to-order food at higher prices, without full table service. This report surveyed 201 US owners and partners across both formats. See who we surveyed and how.
Which restaurant positions are hardest to fill?+
Cooks and line cooks, named by 37% of QSR and fast casual owners. Assistant or deputy managers (27%), cashiers (25%) and store managers (21%) are next. Every role surveyed, from dishwasher to shift manager, was named by at least 11% of owners. See chapter two, restaurant hiring and retention.
How are restaurants responding to the labor shortage?+
68% of QSR and fast casual owners changed their hiring strategy in 2023. Among them, 48% offered additional benefits, 42% raised starting wages and 27% added flexible hours. Only 12% prioritized retaining current staff to reduce the need for hiring. See chapter two, restaurant hiring and retention.
How do restaurants communicate with their employees?+
Mostly face to face. 40% of owners use in-person meetings as their primary channel, and 38% hold staff meetings weekly. For urgent changes, 46% pick up the phone, followed by group text and mobile apps. 63% use some technology, such as scheduling software or communication apps. See chapter three, restaurant employee communication.
What are the biggest employee communication challenges in restaurants?+
Scheduling. 40% of restaurant owners say finding a time for all-staff meetings across shifts is a barrier, more than any other. Employees lacking access to technology or the skills to use it (34%) and messages not checked in time (24%) follow, then language or cultural barriers (20%). Owners in poor or critical financial health most often cite having no centralized platform. See chapter three, restaurant employee communication.
What technology do QSR and fast casual restaurants use most?+
Online ordering and delivery platforms, used by 51% of restaurants surveyed. Nothing else passed 30%: POS systems (27%), mobile apps for ordering and loyalty (27%), customer feedback systems (24%), scheduling software (23%), inventory software (20%), digital menu boards or kiosks (19%) and digital payment (17%). See chapter five, restaurant technology adoption.
What are the barriers to technology adoption in restaurants?+
Cost first. 51% of QSR and fast casual owners name high upfront investment as a barrier, more than any other. Difficulty training staff (32%), data security concerns (31%) and integration with existing systems (30%) follow. Belief is broad: 68% expect technology to be a major or significant force in the industry's future. See chapter five, restaurant technology adoption.
How do restaurant owners feel about third-party delivery apps like DoorDash and Uber Eats?+
Mostly positive, with one big complaint. 55% rate their experience positive or very positive, 23% are neutral and 22% negative. High commission fees are the most named challenge (43%), then delivery times or food quality on arrival (38%). Uber Eats and Grubhub were the most used platforms, and 72% run promotions through delivery apps. See chapter six, delivery and ghost kitchens.
What percentage of restaurants operate ghost kitchens?+
61% of QSR and fast casual restaurants surveyed in 2023 operated a ghost kitchen, a kitchen that cooks for delivery or pickup only. 42% run one alongside a dining space and 19% operate exclusively as a ghost kitchen. Another 22% are considering it. Top concerns are food quality in transit (45%) and dependence on platform fees (42%). See chapter six, delivery and ghost kitchens.
What were restaurant owners' top priorities for the year ahead?+
Growth. Expanding to new locations and menu innovation tie at 36% each, followed by customer experience (30%), employee training and retention (22%) and digital transformation (21%). For specific initiatives, 43% plan new locations, 40% plan marketing campaigns and 34% plan menu changes. 64% are optimistic about their restaurant's future. See chapter seven, outlook and priorities.
Who conducted the QSR and Fast Casual Restaurant Report, and how?+
Raydiant, now Displai, surveyed 201 owners or partners of quick service and fast casual restaurants in the United States. The survey ran online through Pollfish using organic sampling, starting October 31, 2023. The largest groups operate 5 to 10 locations and have been open four to six years. Select-all questions sum to more than 100%. See who we surveyed and how and how to cite this report.
Displai
See what the crew sees
Displai puts live menus, promotions and team performance on the screens already in your restaurant, and reads the numbers straight from your POS. Thirty minutes is enough to see it running on your stores.